mldr 0.2.51 includes new plot functionality
We have released a new version of mldr, 0.2.51, already live on CRAN. It fixes a recently found bug and adds functionality to the plotting function.
Plot improvements
Multiple plots in one call
The plot function now allows a vector of plot types as its type parameter. This results in the generation of multiple plots, with a pause between them if needed to display all of them separately. The following is an example of this functionality:
plot(emotions, type = c("LB", "LSB", "LH", "LSH"))
Coloring plots
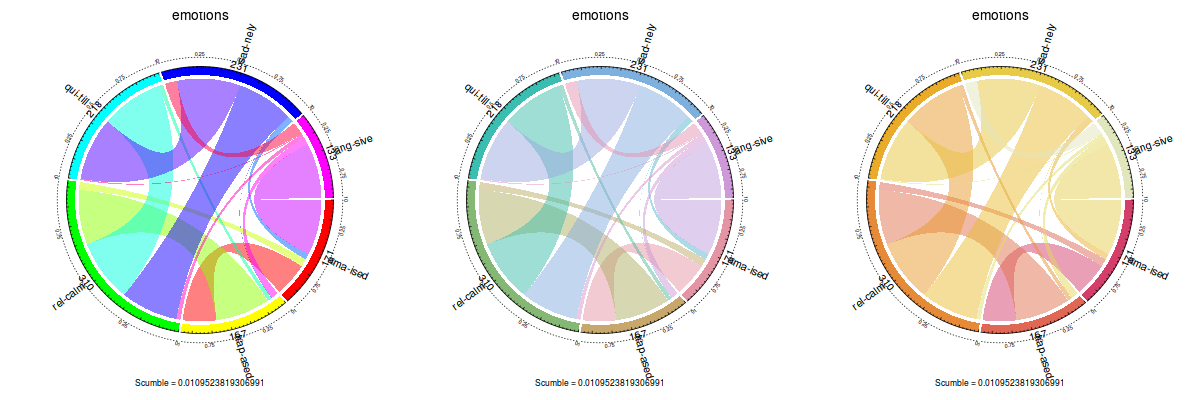
Until now, color in plots were fixed and couldn’t be changed by the user. The update adds the col and color.function parameters. The former can be used on all plot types except for the label concurrence plot, and must be a vector of colors. The latter is only used on the label concurrence plot and accepts a coloring function, such as rainbow or heat.colors, or the ones provided by the colorspace package:
layout(matrix(c(1, 2, 3), 1, 3))
plot(emotions, color.function = rainbow)
plot(emotions, color.function = colorspace::rainbow_hcl)
plot(emotions, color.function = colorspace::heat_hcl)
Bug fixes
A bug was found when loading sparse datasets with a certain formatting. This has been fixed on the update and shouldn’t be a problem anymore.